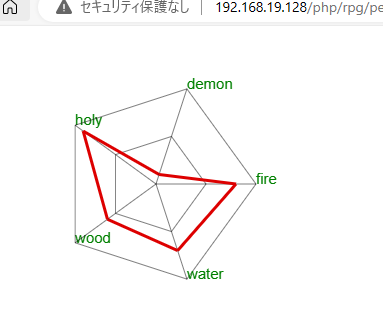
属性パラメータ等でよく使用される、レーダーチャートを作成するjavascriptのサンプルを作成したので、PHPから値を渡して表示されることを確認しました。
外部のJSは使用していないので、このままのソースで使用できます。
多角形のレーダーチャートを表示する関数
関数のプログラムは次の通りです。
<!DOCTYPE html>
<html lang="ja">
<body>
<canvas id="myCanvas" width="500" height="300"></canvas>
<?php
//PHP側で値を指定 0~10の範囲で表示範囲に収まります
$fire = 8;
$water = 7;
$wood = 6;
$holy = 9;
$demon = 1;
?>

<script>

//値の受け渡し keyがそのままグラフに表示される

var attibute_Array = {
	fire: <?php echo $fire; ?>,
	water: <?php echo $water; ?>,
	wood: <?php echo $wood; ?>,
	holy: <?php echo $holy; ?>,
	demon: <?php echo $demon; ?>
};

var canvas = document.getElementById("myCanvas");
var ctx = canvas.getContext("2d");

//補助線描画用
ctx.br_line = function (sx, sy, ex, ey) {
	this.strokeStyle = "#000000";
	this.lineWidth = .5; // 線の幅
	this.beginPath();
	this.moveTo(sx, sy);
	this.lineTo(ex, ey);
	this.stroke();
};

//パラメータ線描画用
ctx.red_line = function (sx, sy, ex, ey) {
	this.strokeStyle = "#DD0000";
	this.lineWidth = 3; // 線の幅
	this.beginPath();
	this.moveTo(sx, sy);
	this.lineTo(ex, ey);
	this.stroke();
};

//テキスト描画用
ctx.pict_text = function (x,y,str){
	ctx.font = "15px Arial"; // フォントを指定
	ctx.fillStyle = "#008000"; // 黒色
	ctx.fillText(str, x, y); // テキストと座標を指定
};

//多角形ビュー
ctx.drawPolygonView = function (centerX, centerY, radius,attributes) {
	var keys = Object.keys(attributes);
	var keys_n = keys.length;

	for (var i = 0; i < keys_n; i++) {
		var angle = (i * 2 * Math.PI) / keys_n;
		var next_angle = ((i+1) * 2 * Math.PI) / keys_n;

		//外苑頂点
		var x = centerX + radius * Math.cos(angle);
		var y = centerY + radius * Math.sin(angle);

		//次の外苑頂点
		var next_x = centerX + radius * Math.cos(next_angle);
		var next_y = centerY + radius * Math.sin(next_angle);

		//外苑中間
		var half_x = centerX + radius * 0.5 * Math.cos(angle);
		var half_y = centerY + radius * 0.5 * Math.sin(angle);

		//次の外苑中間
		var half_next_x = centerX + radius * 0.5 * Math.cos(next_angle);
		var half_next_y = centerY + radius * 0.5 * Math.sin(next_angle);

		//パラメータの値
		var my_x = centerX + radius* (attributes[keys[i % keys_n]] / 10) * Math.cos(angle);
		var my_y = centerY + radius* (attributes[keys[i % keys_n]] / 10) * Math.sin(angle);

		//次のパラメータの値
		var my_next_x = centerX + radius* (attributes[keys[(i+1) % keys_n]] / 10) * Math.cos(next_angle);
		var my_next_y = centerY + radius* (attributes[keys[(i+1) % keys_n]] / 10) * Math.sin(next_angle);

		//枠
		//ラベル
		this.pict_text(x,y,keys[i]);

		//外線
		this.br_line(x, y,next_x,next_y);

		//中線
		this.br_line(half_x, half_y, half_next_x, half_next_y);

		//放射線
		this.br_line(centerX, centerY, x, y);

		//値
		this.red_line(my_x, my_y, my_next_x, my_next_y);
	}
};

//関数の呼び出し
//drawPolygonView(表の中心X,中心Y,表の半径,値が入った連想配列)
ctx.drawPolygonView(250, 150, 100,attibute_Array);
</script>
</body>
</html>
実行結果は次の通りです。

プログラムの実行結果
受け渡した連想配列の分だけ、多角形のレーダーチャートを表示します。
chart.js等のライブラリを使用することも考えましたが、自分で作った方がプログラムの理解が進むと思い作成しました。
一般のライブラリに機能は及びませんが、必要な機能だけに絞っているので使いやすいと思っています。

